The Rhythm of the Market: How Dollar-Cost Averaging Protects Your Wealth
Imagine standing on the deck of a ship in the middle of the North Atlantic. The waves swell up to ten feet, crashing against the hull, only to pull back and leave the water momentarily still. Trying to predict the exact second the next crest will hit is an exhausting exercise in futility. Yet, this is exactly what millions of Canadians try to do with their hard-earned savings every single day in the stock market.
They wait. They watch the news. They check their phone screens. They ask themselves: Is today the absolute bottom? Should I buy now, or will it drop another five percent tomorrow?
This psychological tug-of-war is called market timing, and it is one of the most reliable ways to lose money and sleep. Fortunately, there is a better, stress-free way that relies on mathematics rather than guesswork: Dollar-Cost Averaging (DCA).
What is Dollar-Cost Averaging?
Dollar-Cost Averaging is a simple strategy where you invest a fixed amount of money at regular, predetermined intervals (such as weekly, bi-weekly, or monthly), regardless of whether the market is climbing, falling, or moving sideways.
Instead of trying to guess when to buy, you automate your contributions. The core magic of this approach is elegant:
- When the market price is high, your fixed dollar amount automatically buys fewer shares.
- When the market price is low, your fixed dollar amount automatically buys more shares.
A Tale of Two Investors: Sophia vs. Marcus
To see how this works in the real world, let's look at two Canadian investors, Marcus and Sophia. Both have a bonus of $12,000 to invest in a volatile market index fund. The fund starts at $100 per share.
Marcus: The Lump-Sum Timer
Marcus believes he can time the market. In January, when the fund is at $100, he feels confident and invests his entire $12,000 at once.
- Initial Share Price: $100
- Shares Purchased: 120 shares
- Total Invested: $12,000
Shortly after Marcus invests, market volatility hits. The share price plunges over the spring, hitting a low of $50, before slowly climbing back to $100 by December. At the end of the year, Marcus's 120 shares are valued at $100 each. His portfolio is worth exactly $12,000. He made 0% return and spent the entire year feeling stressed about his paper losses.
Sophia: The DCA Disciplinarian
Sophia decides to take the stress-free path. She sets up an automated monthly contribution of $1,000 on the first of every month for 12 months. Let's watch how her shares accumulate as the market fluctuates:
| Month | Contribution | Share Price | Shares Acquired | Cumulative Shares |
|---|---|---|---|---|
| Month 1 (Jan) | $1,000 | $100.00 | 10.00 | 10.00 |
| Month 2 (Feb) | $1,000 | $80.00 | 12.50 | 22.50 |
| Month 3 (Mar) | $1,000 | $60.00 | 16.67 | 39.17 |
| Month 4 (Apr) | $1,000 | $50.00 (Dip) | 20.00 | 59.17 |
| Month 5 (May) | $1,000 | $70.00 | 14.29 | 73.46 |
| Month 6 (Jun) | $1,000 | $85.00 | 11.76 | 85.22 |
| Month 7 (Jul) | $1,000 | $90.00 | 11.11 | 96.33 |
| Month 8 (Aug) | $1,000 | $80.00 | 12.50 | 108.83 |
| Month 9 (Sep) | $1,000 | $75.00 | 13.33 | 122.17 |
| Month 10 (Oct) | $1,000 | $85.00 | 11.76 | 133.93 |
| Month 11 (Nov) | $1,000 | $95.00 | 10.53 | 144.46 |
| Month 12 (Dec) | $1,000 | $100.00 | 10.00 | 154.46 |
The Results
At Month 12, the share price has returned to exactly $100.00. Let's see where our two savers stand:
- Marcus (Lump Sum): Holds 120 shares. Value: $12,000. Net Profit: $0.
- Sophia (DCA): Holds 154.46 shares. Value: $15,446. Net Profit: $3,446 (28.7% Gain!).
How did Sophia end up 28.7% richer than Marcus, even though the final share price is exactly where it started? Because of the dips! In April, when Marcus was biting his nails, Sophia's $1,000 was buying 20 full shares at $50 each instead of the 10 shares she bought in January. She acquired cheap assets, which accelerated her growth when the market recovered.
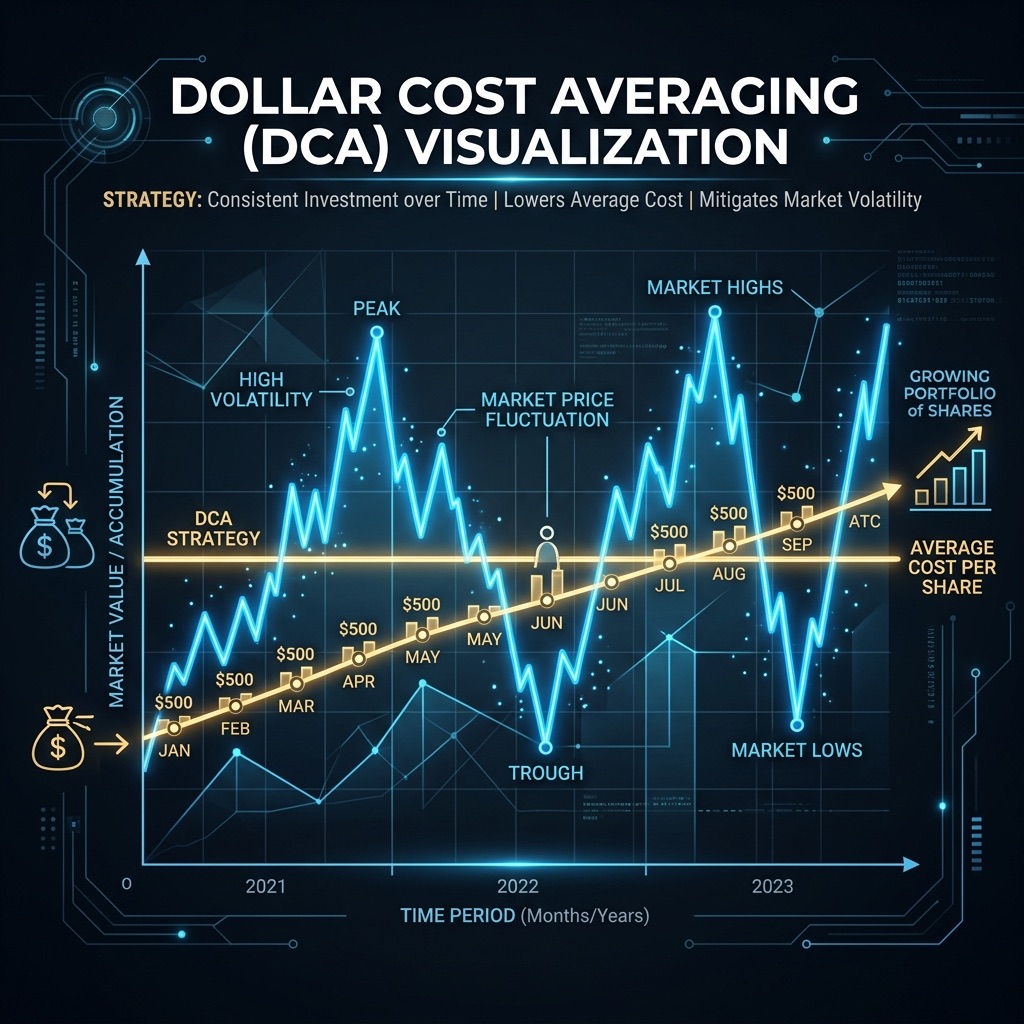
Visualizing DCA vs. Lump Sum Performance
The chart below displays Sophia's DCA portfolio value growth compared to Marcus's Lump Sum, showing how volatility works in favor of the systematic saver.
Why is Dollar-Cost Averaging So Crucial for Canadians?
Beyond the simple math, DCA solves the biggest enemy of wealth building: human emotion.
When markets tumble, the headlines scream panic. It is natural to feel afraid. Under a lump-sum strategy, your fear will often freeze you into doing nothing, or worse, pressure you into selling at the worst possible time. With DCA, volatility becomes your ally. When the market falls, you don't panic—you simply know that your automated plan is busy buying shares at a discount. It shifts your mindset from "the market is crashing" to "the assets I want are on sale."
How to Set Up Your DCA Strategy
The beauty of DCA is that it can be applied to any investment account. In Canada, you can leverage DCA using tax-advantaged registered accounts to supercharge your wealth:
- TFSA (Tax-Free Savings Account): Set up automated weekly or monthly transfers into index funds or diversified portfolios. All of your gains, compounding growth, and future withdrawals are 100% tax-free.
- RRSP (Registered Retirement Savings Plan): Automate a percentage of your paycheck directly into your retirement portfolio. Not only do you benefit from DCA, but you also lower your net tax taxable income, leading to a substantial tax refund.
- FHSA (First Home Savings Account): If you are saving for a down payment over the next few years, volatility is a major risk. A steady DCA strategy inside an FHSA lets you accumulate down payment capital safely while claiming a tax deduction on contributions.
See It In Action: Calculate Your Growth
Want to see how your own savings would perform under different return rates, volatility levels, and time horizons? We have built a proprietary, interactive tool that simulates real market volatility. You can test your initial savings, regular contribution, and see exactly how DCA accumulates wealth compared to a static savings account or a single lump sum.
👉 Open the Dollar-Cost Averaging Simulator now.
Take Control of Your Financial Legacy
Building wealth is not about hitting a home run on a single lucky trade. It is about the discipline of watering the tree every single morning, year after year. By automating your savings and adopting a Dollar-Cost Averaging mindset, you align your money with time and compounding growth.
If you want to design a tailored investment and insurance strategy that fits your family's long-term plan, the advisors at OneProtection are here to assist. Contact us today to secure your financial future.